In the last post in this series, we looked at some of the tools and rituals used when working agile, and I mentioned Road-Maps as a way to visualize the progress and development of a digital product.
In this post I will dig deeper into the Road-Maps and how they are used
As described in the earlier posts in this series, Agile methodologies prioritize “get things done” over documentation. Another big difference from classical waterfall projects, is that Agile chops up the work to be done in smaller pieces, where we can adjust our priorities as the world changes, or new needs surface. You can compare this with two different approaches of planning a trip from one end of a city to the other end of the city:
| The Waterfall approach the the city trip: If you would plan your journey across the city according to the waterfall project model, you would collect as much information about the traffic, possible construction sites, time each traffic light, check the speed limits on every possible route and after having analyzed all the data you would put your shoes on and start walking.This approach may seem logical in order to find the fastest route, but since a traffic accident can happen at any time, a traffic light may be broken at any time, and all sorts of other unforeseen things can happen, this approach relies on false security (exactly as described in the first post in this series). In practice this methodology means that you spend a lot of time doing unnecessary work that takes a lot of time, before you have even started your journey. The Agile approach to the city trip: If you would use an agile approach instead, you would find out the direction you need to go, in order to get to the other side of the city, and then you would start walking. You do this because you know that the data you can collect before the trip will be outdated as soon as you have tied your shoelaces, and therefore you decide to let the walk play out in according to the reality in each moment of the trip. Yes, this may mean that your walk is slightly longer than it would be if you would have planned each step and each turn beforehand. However, since you do not spend time gathering data of little or no use, you will probably reach the goal of the journey before the “waterfall person” has even finalized his analysis of the data collected. What you do instead, is to reevaluate your route at each necessary moment, and you take decisions based on the reality in front of your eyes. |
This is where our Product Road-Maps come in.
I like to do my Road-Maps with a “Crawl, Walk, Run” approach, where we describe the values we want to achieve. In the example that follows we have a Product Owner who has several products she is responsible for. In some cases it can also be beneficial to have “right now” visualization.
We therefore start looking at what we need to create or achieve, and we should use the OKRs discussed in the previous post, for setting the Levers in the left column.
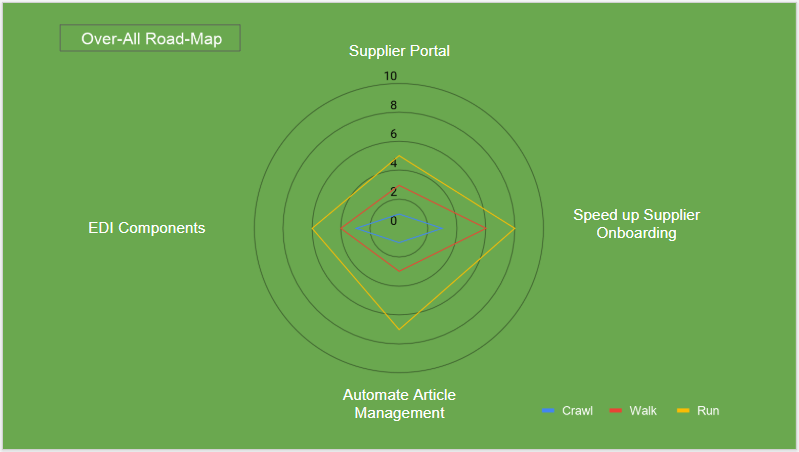
The first picture describes the four products our imaginary product owner needs to work with.
As you can see below, each product goes through a development over the course of 9 to 12 months. You also notice that the over all road-map below, is not detailed at all and only describes the over-all development on a high level.

To visualize the progress and the value the products are to deliver for the company, we use a spider web diagram. It is important to remember that the below diagram is, in this case, a “gut feeling estimation”. If you have real data to access it is better to use that. An example of that could be a product which is to decrease the Full Time Equivalents (FTEs) of a specific process that starts out as manual and over the course of a 9-12 months period will become increasingly automated.
In order to become more specific regarding the products, we now need to do a drill down in them. For this example I have chosen to use the Supplier Portal, we saw above.
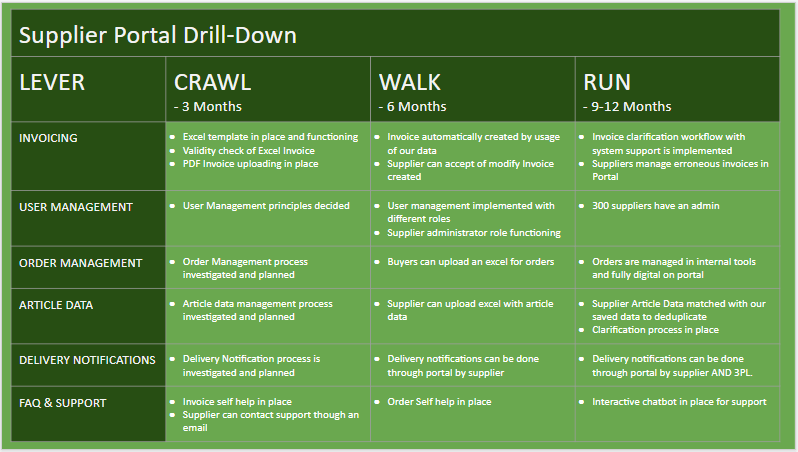
As you can see, we here become much more detailed, and it is normally for this level we can also find hard data to feed our spider chart diagram with.
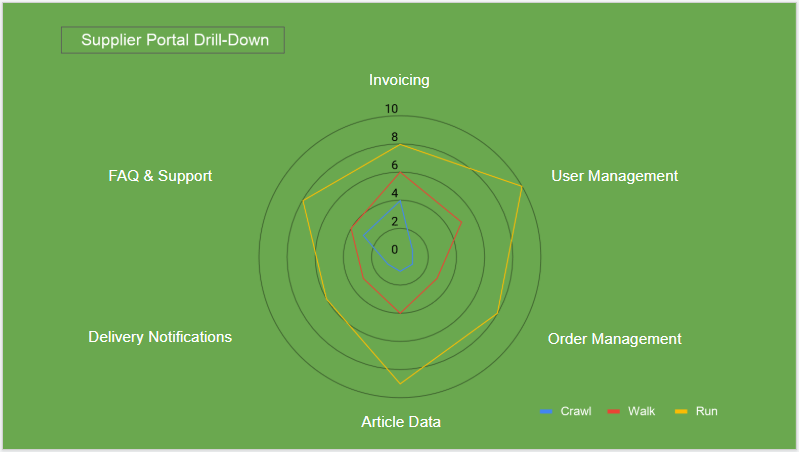
The idea with this kind of Road-Map is to visualize the value a product will bring to the company and/or the stakeholders. As mentioned above, we can here probably use the decrease of a Full Time Equivalents as one data point. Another could be money saved in the manual handling, or increase in data quality that today causes problems, or high work load.
These Road-Maps should be readily available for everyone concerned in the company, so that they know whay is going to be delivered and when.
It is important to understand that the Road-Map becomes more uncertain the further into the future we look, and that what is planned for the “Run Phase” may very well change and will detailed out when we approach that point in time.
In the next post we will take a look at how to lead and feedback culture. Two very important aspects of Agile.

3 thoughts on “Part 6: How to set a course and visualize your progress”